Analyzing Linear and Exponential Functions
Linear
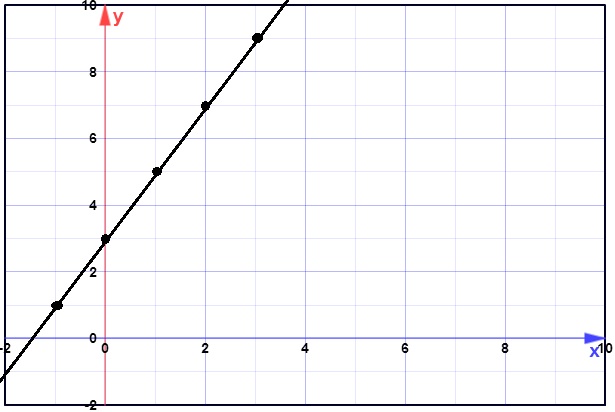
To graph a linear function, such as f(x)=2x+3, you first look at the y-intercept (3). Next, you see the slope (2x) and graph that. The line will be sloping upwards because the slope is positive, and will meet the y axis at 3, since that is the y intercept. It will look like this:
To graph a linear function, such as f(x)=2x+3, you first look at the y-intercept (3). Next, you see the slope (2x) and graph that. The line will be sloping upwards because the slope is positive, and will meet the y axis at 3, since that is the y intercept. It will look like this:
Exponential
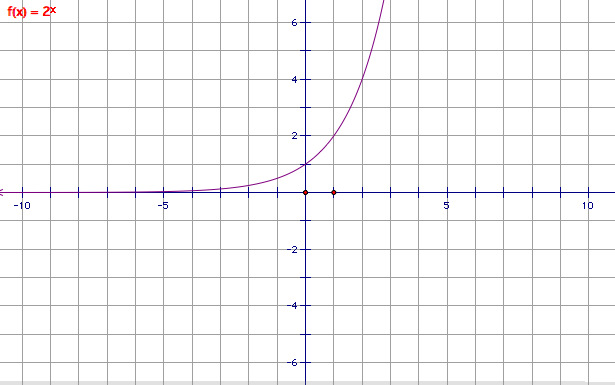
To graph an exponential function, such as f(x)=2^x, you plug in the x values and plot the points. It curves because each y value triples from one term to the next.
To graph an exponential function, such as f(x)=2^x, you plug in the x values and plot the points. It curves because each y value triples from one term to the next.
Algebraic vs. Verbal
So far, every function seen here has been written algebraically. An algebraically written function will look like this: f(x)=4x-5. This is not the only way to show a function, however. You can also write it verbally. An example of this could be f evaluated at x is equal to two x plus five. These two functions, though written differently, show many similarities and also differences. For instance, they are both linear, but the first has a negative y intercept while the second has a positive one, so they will be on opposite sides of the x axis. Both have positive slopes. Keep in mind that every function can be written both ways, not just verbally, or just algebraically.
